Case Study
Hiker’s Weather
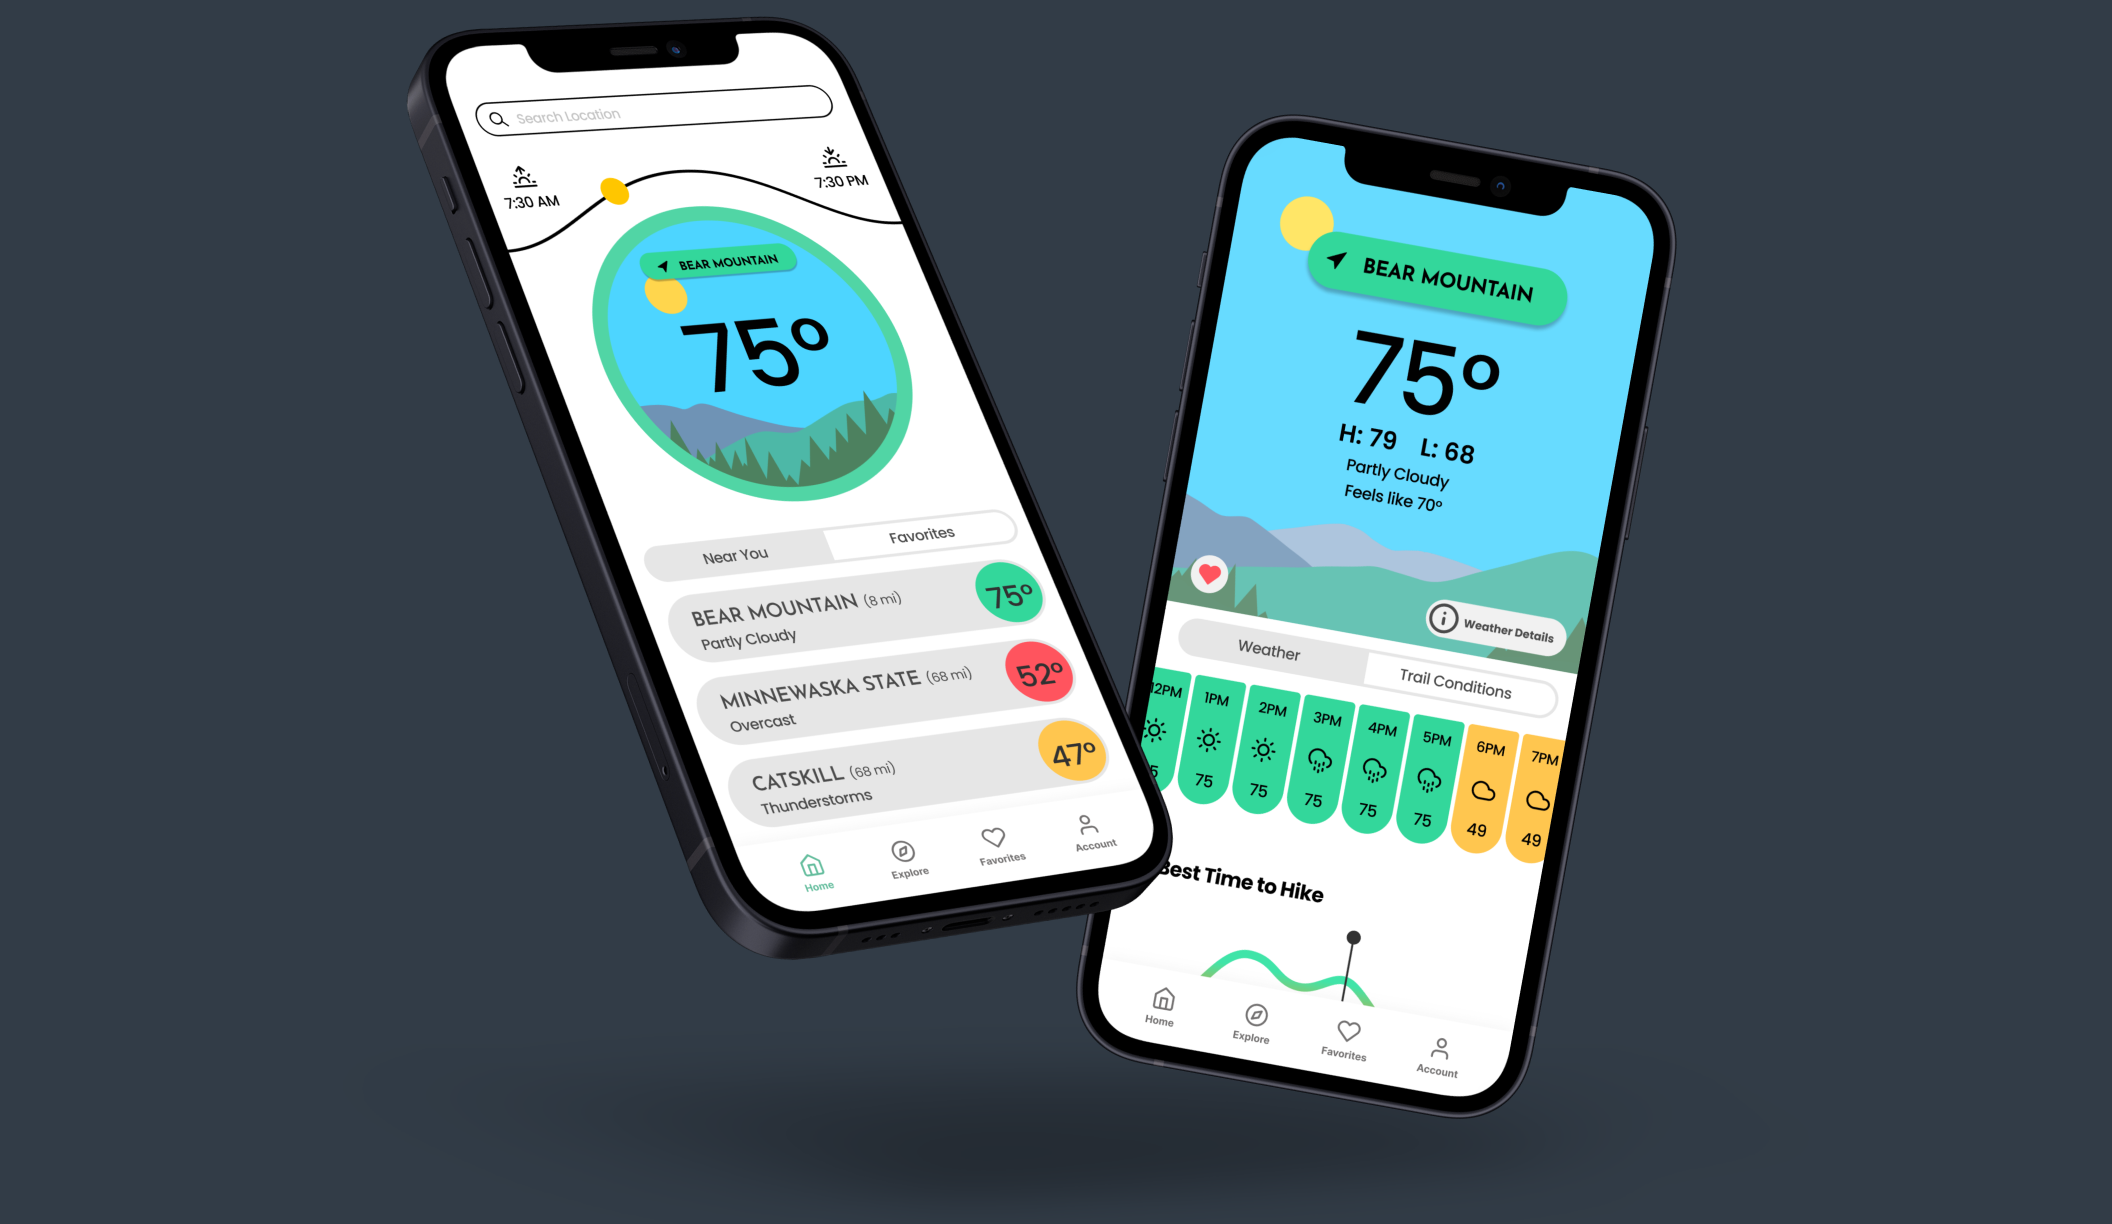
Product Summary: A weather forecast app designed for hikers. The app focuses on learning a user's preferred hiking conditions and experience level. By understanding users' preferences, Hiker’s Weather provides a color-coded report of the mountains that suit their needs.
Role: UX Designer, Lead UI Designer
Client: Hiker’s Weather Startup
Category: Mobile App build
Team: Pinki Mukherji - Producer
Chaemin Kim - UX/UI Designer
Valeriia Koltsova - UX Researcher
Jared Horman - UI Designer
INTRODUCTION
BACKGROUND
Hiker's Weather is a startup that focuses on personalized forecasts from a hiker's perspective. Our client, Tim Luby, is an avid hiker and wanted to craft an app for his community. We developed Hiker's Weather to accommodate hikers' preferences. Our team of five designers had access to existing style guides, conversations with the company's leading designer, and customers for surveys and user interviews.
A key aspect of our clients product was the use of algorithms based on user’s hiking experience level and weather preferences. The algorithmic outputs would result in color coded hiking recommendations.
INVESTIGATION
During our investigation, we uncovered several key insights related to hiking and weather that helped shape our understanding of the problem and informed our approach to designing Hiker's Weather. Here are some of the most important findings:
Weather can significantly impact your hiking experience because it's often unpredictable. Many hikers are often caught off guard when preparing.
Reliable weather data helps hikers make informed decisions for a safer and more enjoyable experience.
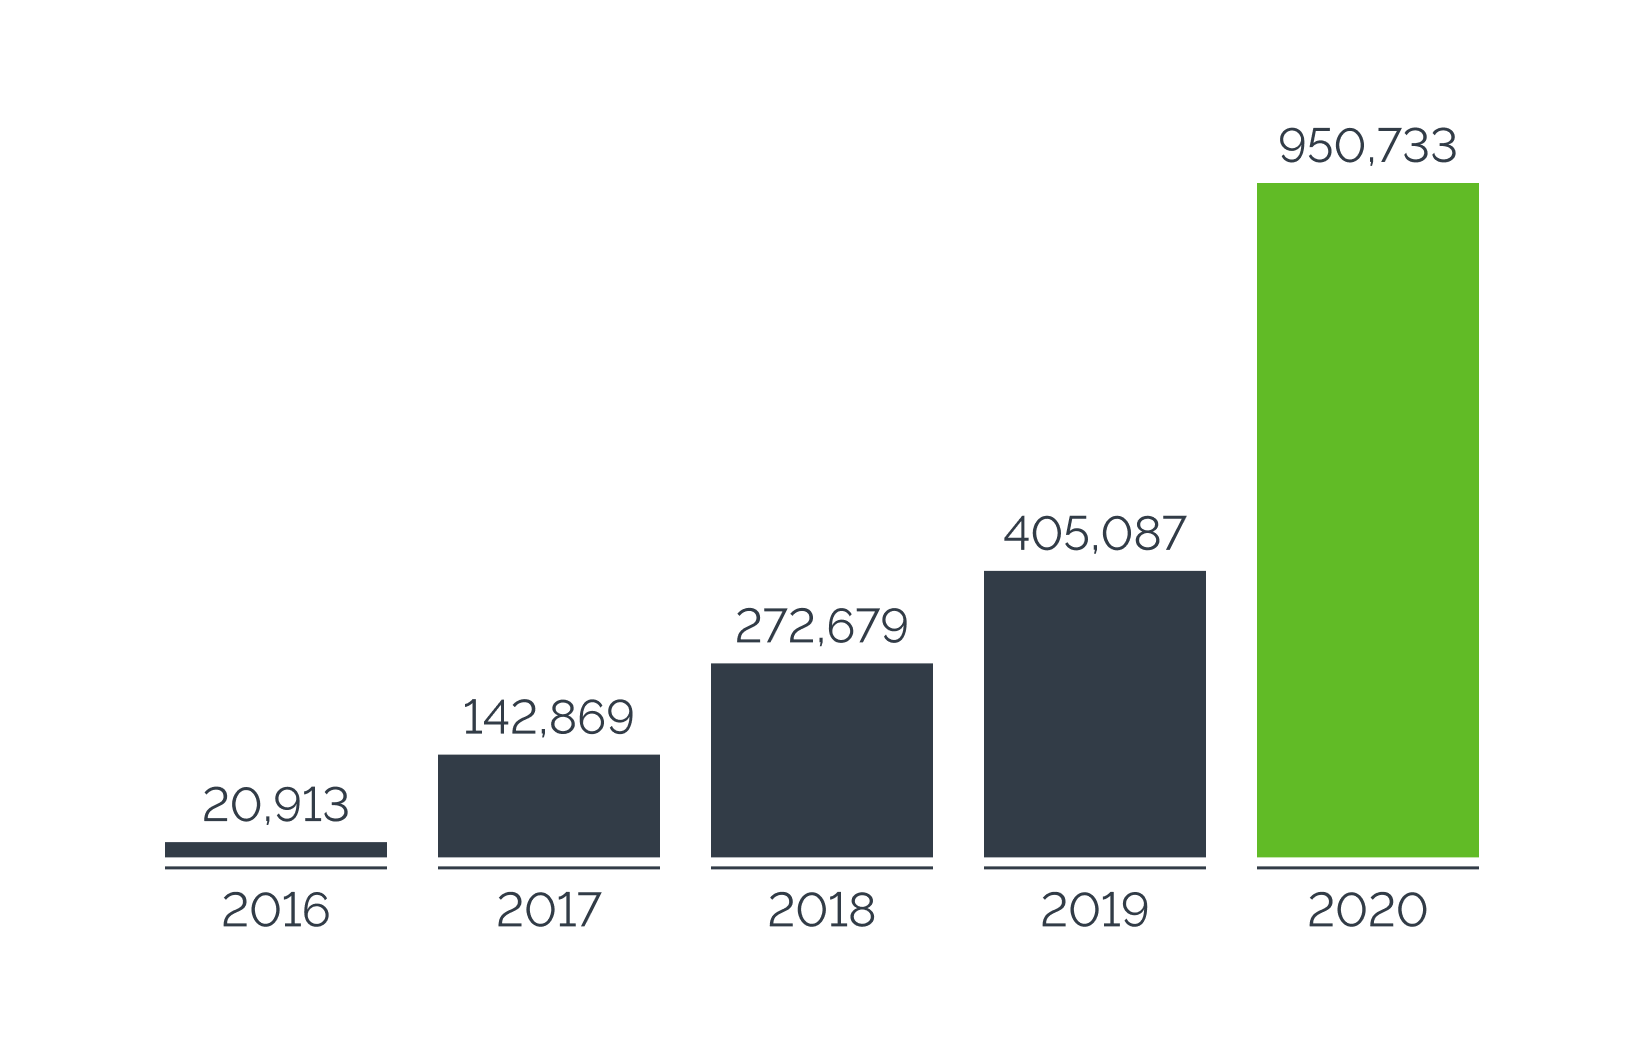
The Covid-19 pandemic has led to an increase in individual hikers by 134.7% in 2020 compared to 2019.
Regular hiking can reduce mental health problems by 50%, and cortisol levels can lower by 13.4% after just 20 minutes.
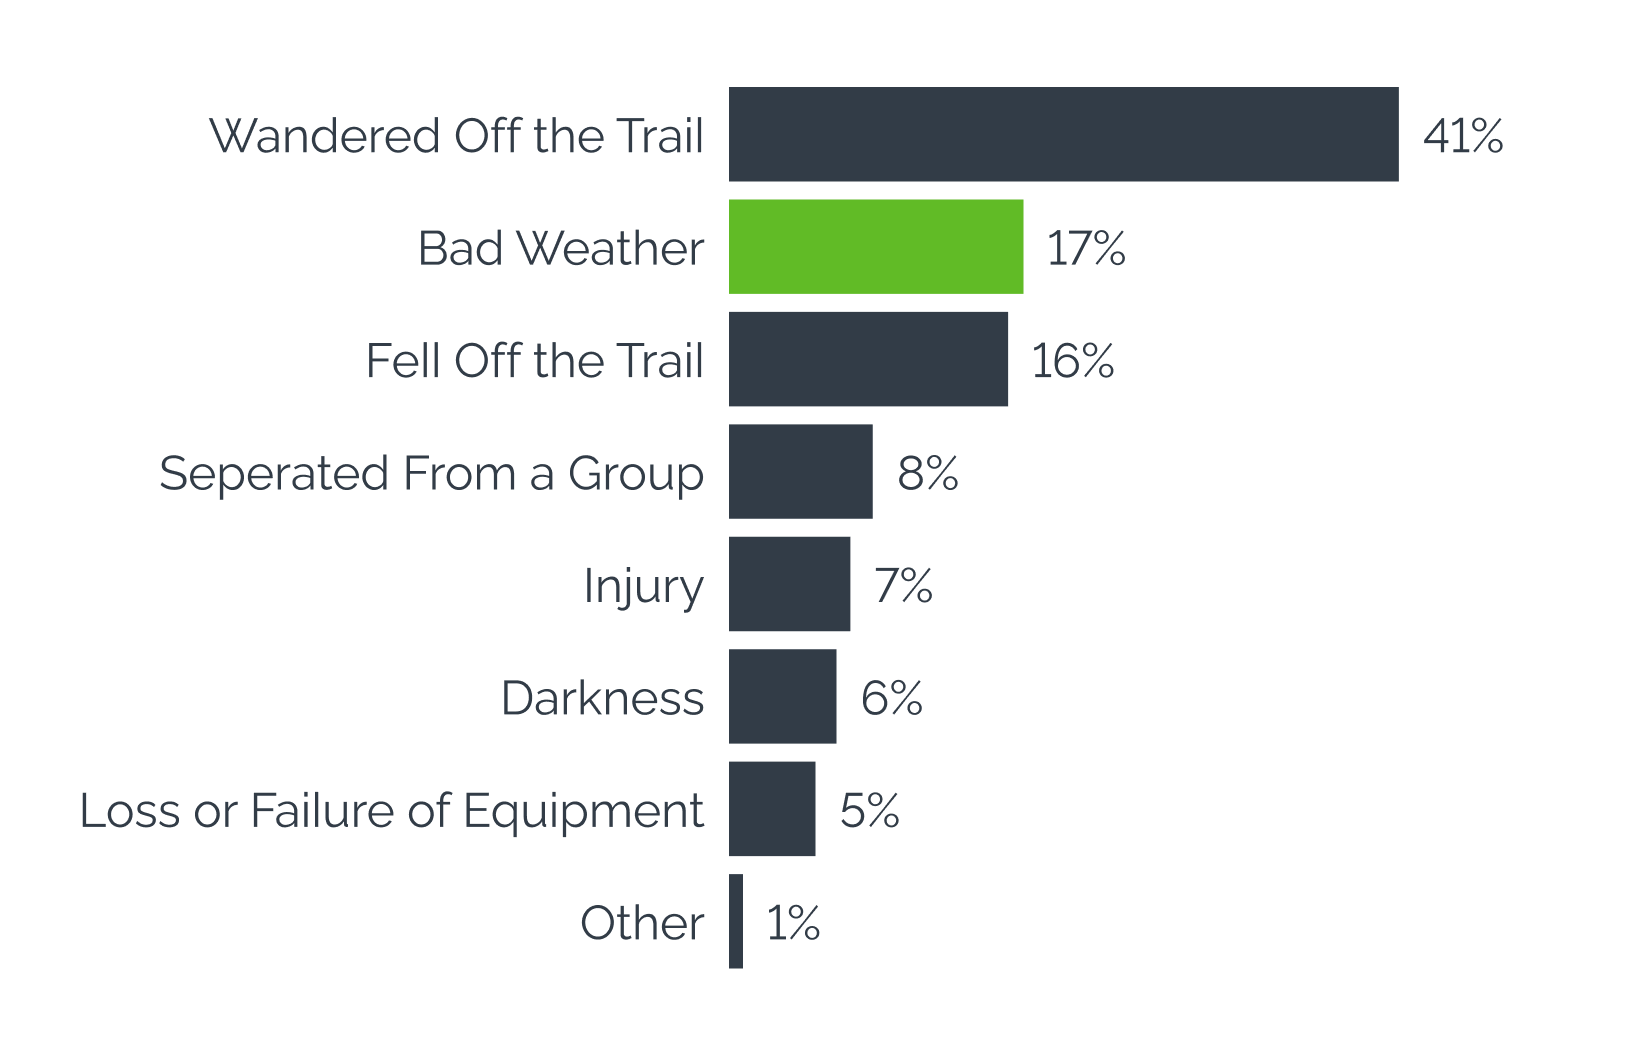
1 in 5 hikers who get lost do so due to weather-related experiences.
REASONS WHY HIKERS GET LOST
NUMBER OF INDIVIDUAL HIKERS IN US PER YEAR
RESEARCH PROCESS
COMPETITIVE & COMPARATIVE ANALYSIS
We conducted a competitive/comparative analysis of weather forecast apps and hiking assistance apps to understand what features were successful in the market and what topics to explore in our user interviews. Here are some of the key findings:
Dark Sky, Climb, and Carrot were excellent weather apps with detailed information, but they didn't provide context specific to hiking.
Weather apps are designed more for everyday lifestyle use and less for outdoor activities.
Hiking apps like Gaia, All Trails, and the Hiking Project have great information on trails and mountain descriptions, including trail type, elevation, difficulty, and views.
Hiking apps lack any real-time display of weather influences on the hike, leaving users to rely on third-party weather apps or other sources for this information.
FEATURE ANALYSIS
KEY FEATURES OF COMPETITORS
All trail:
The main focus is offering info on trail conditions and the ability to track a hike
Gaia Gps:
Showed the difficulty level of a hike and recommended trails based on the user's location.
.Hiking Project:
Users can favorite trails, plan upcoming activities, and report trail conditions for their community.
USER SURVEYS
We distributed our survey to several online hiking communities to gain insight into hikers' reactions to weather and identify a target audience. Our survey received 71 responses, and some key insights include;
99% of hikers check the weather before hiking
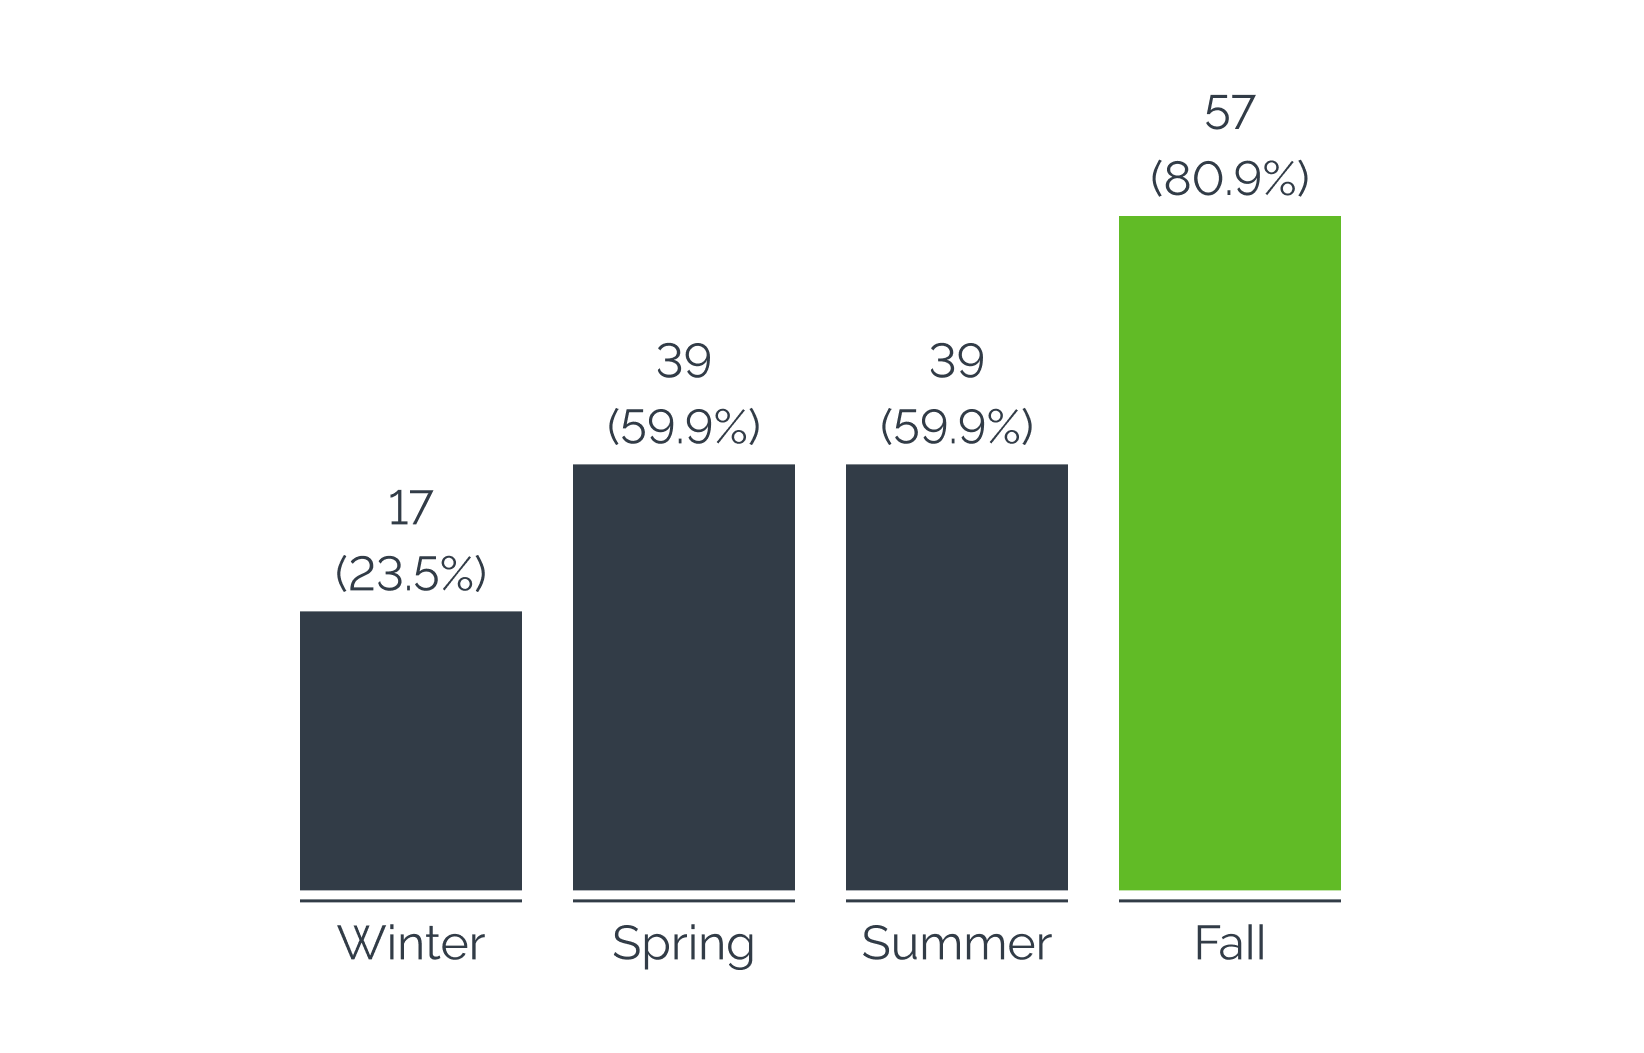
Fall is the most preferred season for hiking
85% of hikers prefer sunny days for hikes
DO YOU CHECK THE WEATHER BEFORE A HIKE?
71 Responses
WHAT IS YOUR PREFERRED SEASON?
71 Responses
USER INTERVIEWS
We interviewed survey respondents using an interview script aligned with our client's goals and previous research. The script allowed for flexibility while ensuring consistency in our findings.
We completed 22 interviews, giving us valuable insights into hiking, including how people plan their hikes, pack for them, deal with the weather, get lost, and what makes for a memorable hike.
After carefully considering the client's needs and user feedback, we identified key takeaways from our research. We learned two important pieces of information that we needed to keep in mind while developing within a short timeframe.
Respondents had no ubiquitous answer for what weather was "ideal" for hiking.
The term "hiker" encompasses many individuals with different needs, so we included detailed weather information for those who want it.
Below are quotes that contextualize our product goals:
MUST HAVE
“I found the forecast is mostly inaccurate because weather is changeable.”
“I like to hike around both sunrise and sunset.”
“I plan according to the weather, such as temperature and wind.”
“I want to know the terrain profile, elevation change, direction, and difficulty level of the trail.”
“I love hiking because it’s therapeutic, and I can be away from everything.”
GOALS:
Promotes therapeutic/escape feel
The difficulty level of trails and the ability to input new data
Weather forecast with day-of and ten forecast
Break down of in-depth weather info
Sunrise/Sunset is important info
Ideal weather conditions
Customized data depending on the hiker's skill level
Map feature
SHOULD HAVE
“I found the weather could be a major variable.”
“I think it’s essential to bring the right equipment and enough food/water.”
“I think it’s critical to have the information about the trail before setting out.”
GOALS:
Safety Tips and a checklist of what to do & bring
Hazards to look out for on the trails
Guide to warning signs of weather
Report trail conditions feature
A Follow-up survey of a hike
Snapshot trail highlights
COULD HAVE
“I want to know the density of hikers on the trail to avoid too many hikers.”
“I plan my trips thoroughly and in advance.”
“I like to share and gain information from the community.”
GOALS:
Peak trail foot-traffic hours
Park amenities
Integrate device with health monitors/activity trackers
Add a calendar feature
Share forecast with family, friends, and community
PERSONA AND USER JOURNEY
To better empathize with our users, we created Erik, an experienced hiker who loves to plan the perfect hike for his friends and family. Erik is an amalgamation of our user interviews' thoughts, needs, and feelings. This allows us to empathize with users behaviors, needs, and pain points.
With Erik’s needs in mind, we crafted his user journey of the recent hike he went on with his father. A User Journey helps us contextualize how and when our app might function in reality;
PERSONA
USER JOURNEY
PROBLEM STATEMENTS
Erik needs a more integrated way to plan hiking around variations in weather so that he can focus on enjoying his hike with his family and friends.
To address Erik's needs, we came up with three questions:
How might we help Erik make informed choices on when to hike based on weather, skill, and time?
How might we provide necessary information and educate users on mountain-based weather?
How might we optimize the hiking experience for Erik based on weather?
DESIGN ITERATIONS
SKETCHING
After completing thorough research, we moved into the sketching phase of the design process. To make the homepage more user-friendly, we prioritized the forecast over the client's initial request for a map page.
We also designed a navigation bar with a homepage, an account page (not shown), and an "explore" page where users can search for a mountain and view its current forecast, sun position, and detailed weather information. Most importantly, we began exploring the visuals of the color-coded output.
IDEATION
Our product design goals were:
Use color-coded outputs to represent varying levels of comfort and safety for temperature, precipitation, and pollen.
Accommodate hikers of different experience levels.
Display sunrise and sunset times for sightseeing and safety.
Show the current and ten-day forecast.
Provide detailed weather information for any mountain, including present and forecasted conditions and trail reports.
Create an onboarding screen to collect user information and define color-coded recommendations.
MID-FIDELITY PROTOTYPE
After sketching, we moved on to creating mid-fidelity mockups using Figma. We focused on three main user paths: Weather Details, Explore Map, and Trail Conditions
WEATHER DETAIL
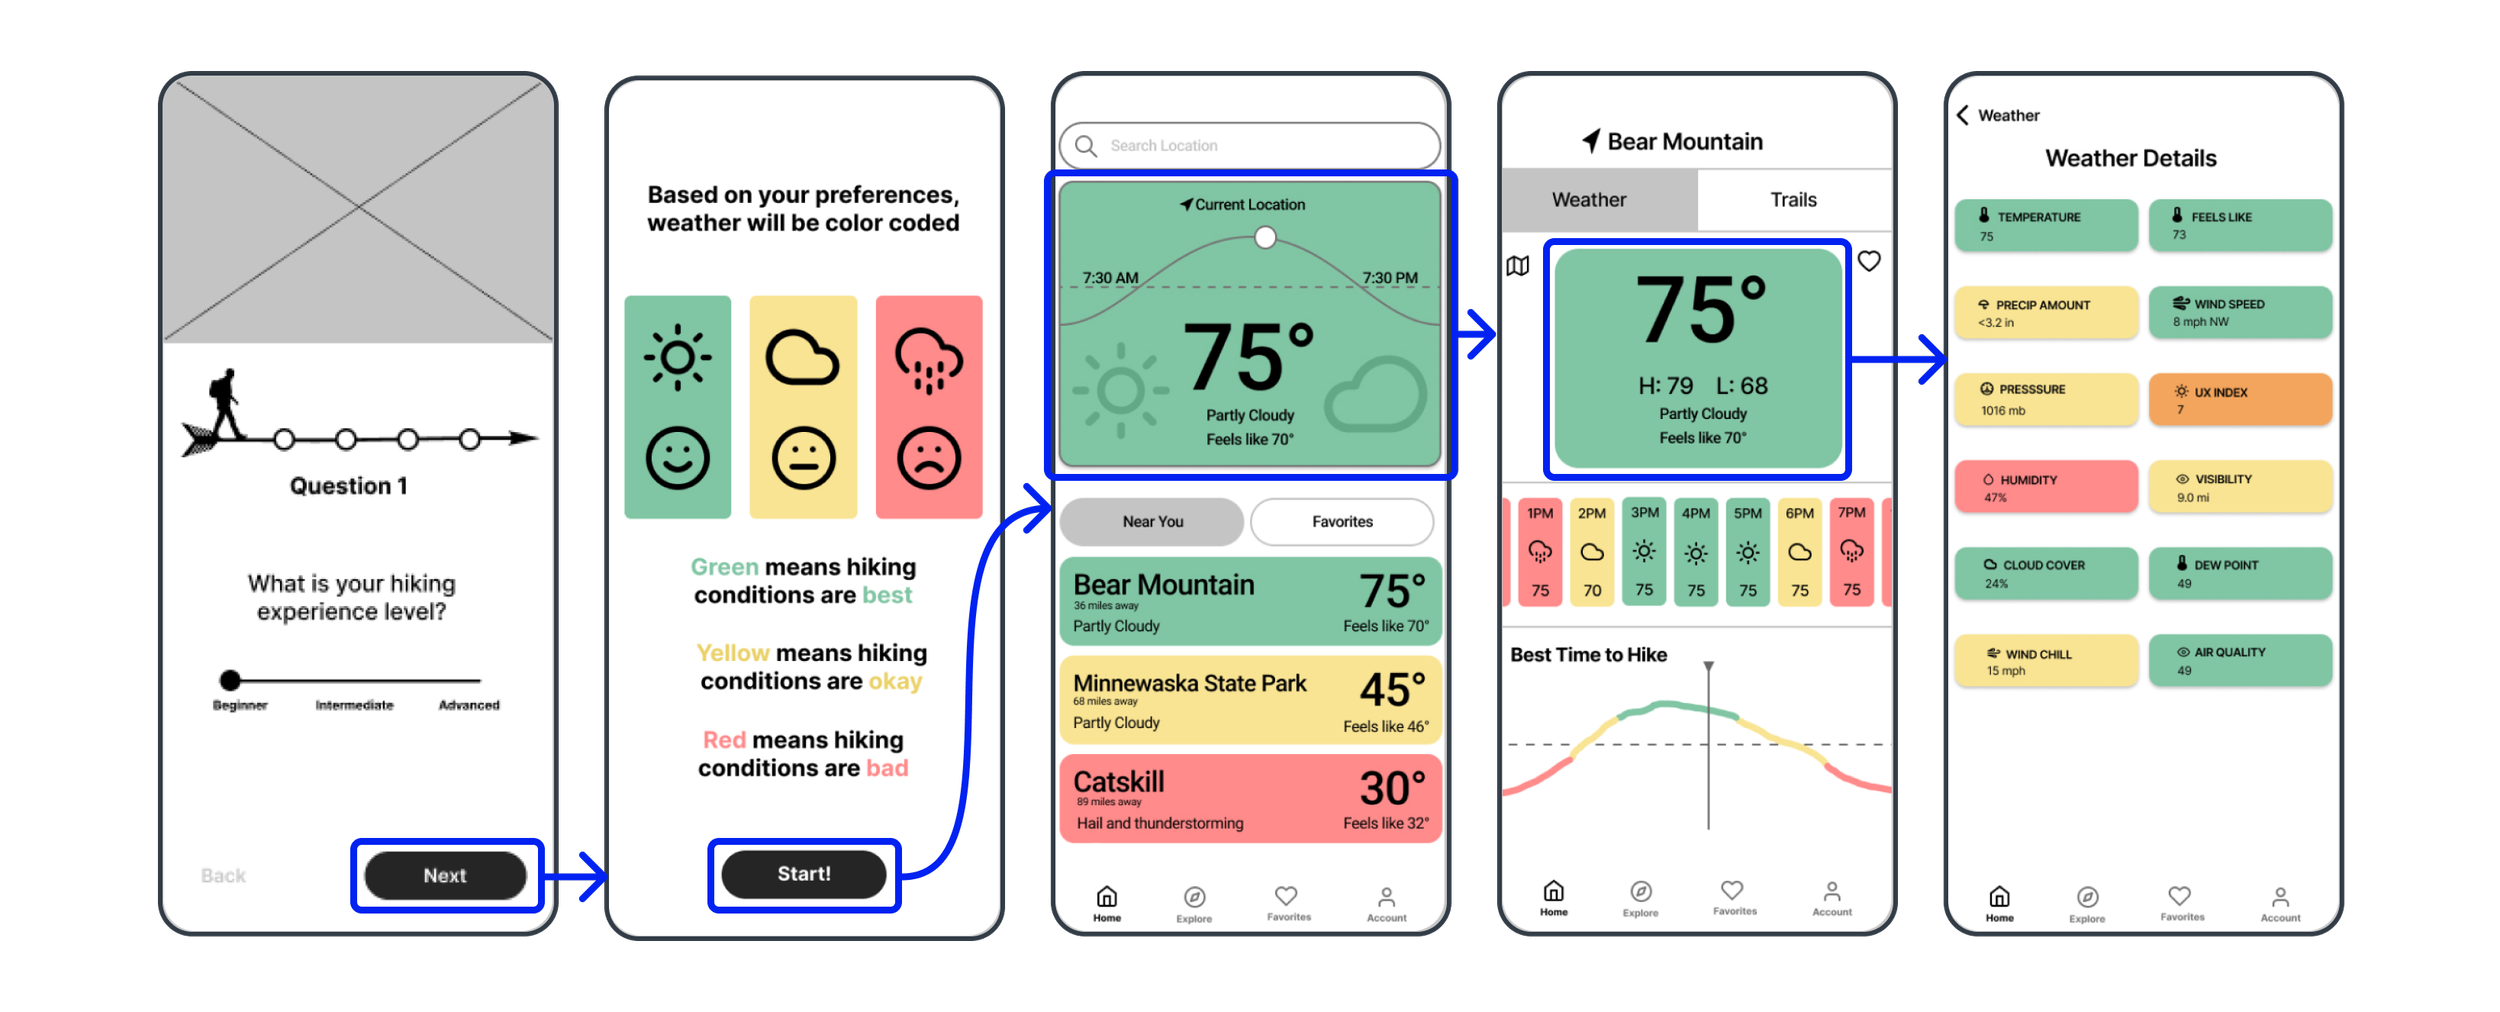
We added an intro page to help users understand the color-coded outputs of our Weather Details section. Green symbolizes the best conditions for hiking, and red represents the poorest conditions for hiking.
We also included the current weather and sun position at the top of the screen; additionally, the “Near You” and “Favorites” sections below diversify and personalize location options. Additionally, we developed the Weather and Weather Detail pages to provide all necessary forecast details and insights into the color grade.
EXPLORE MAP
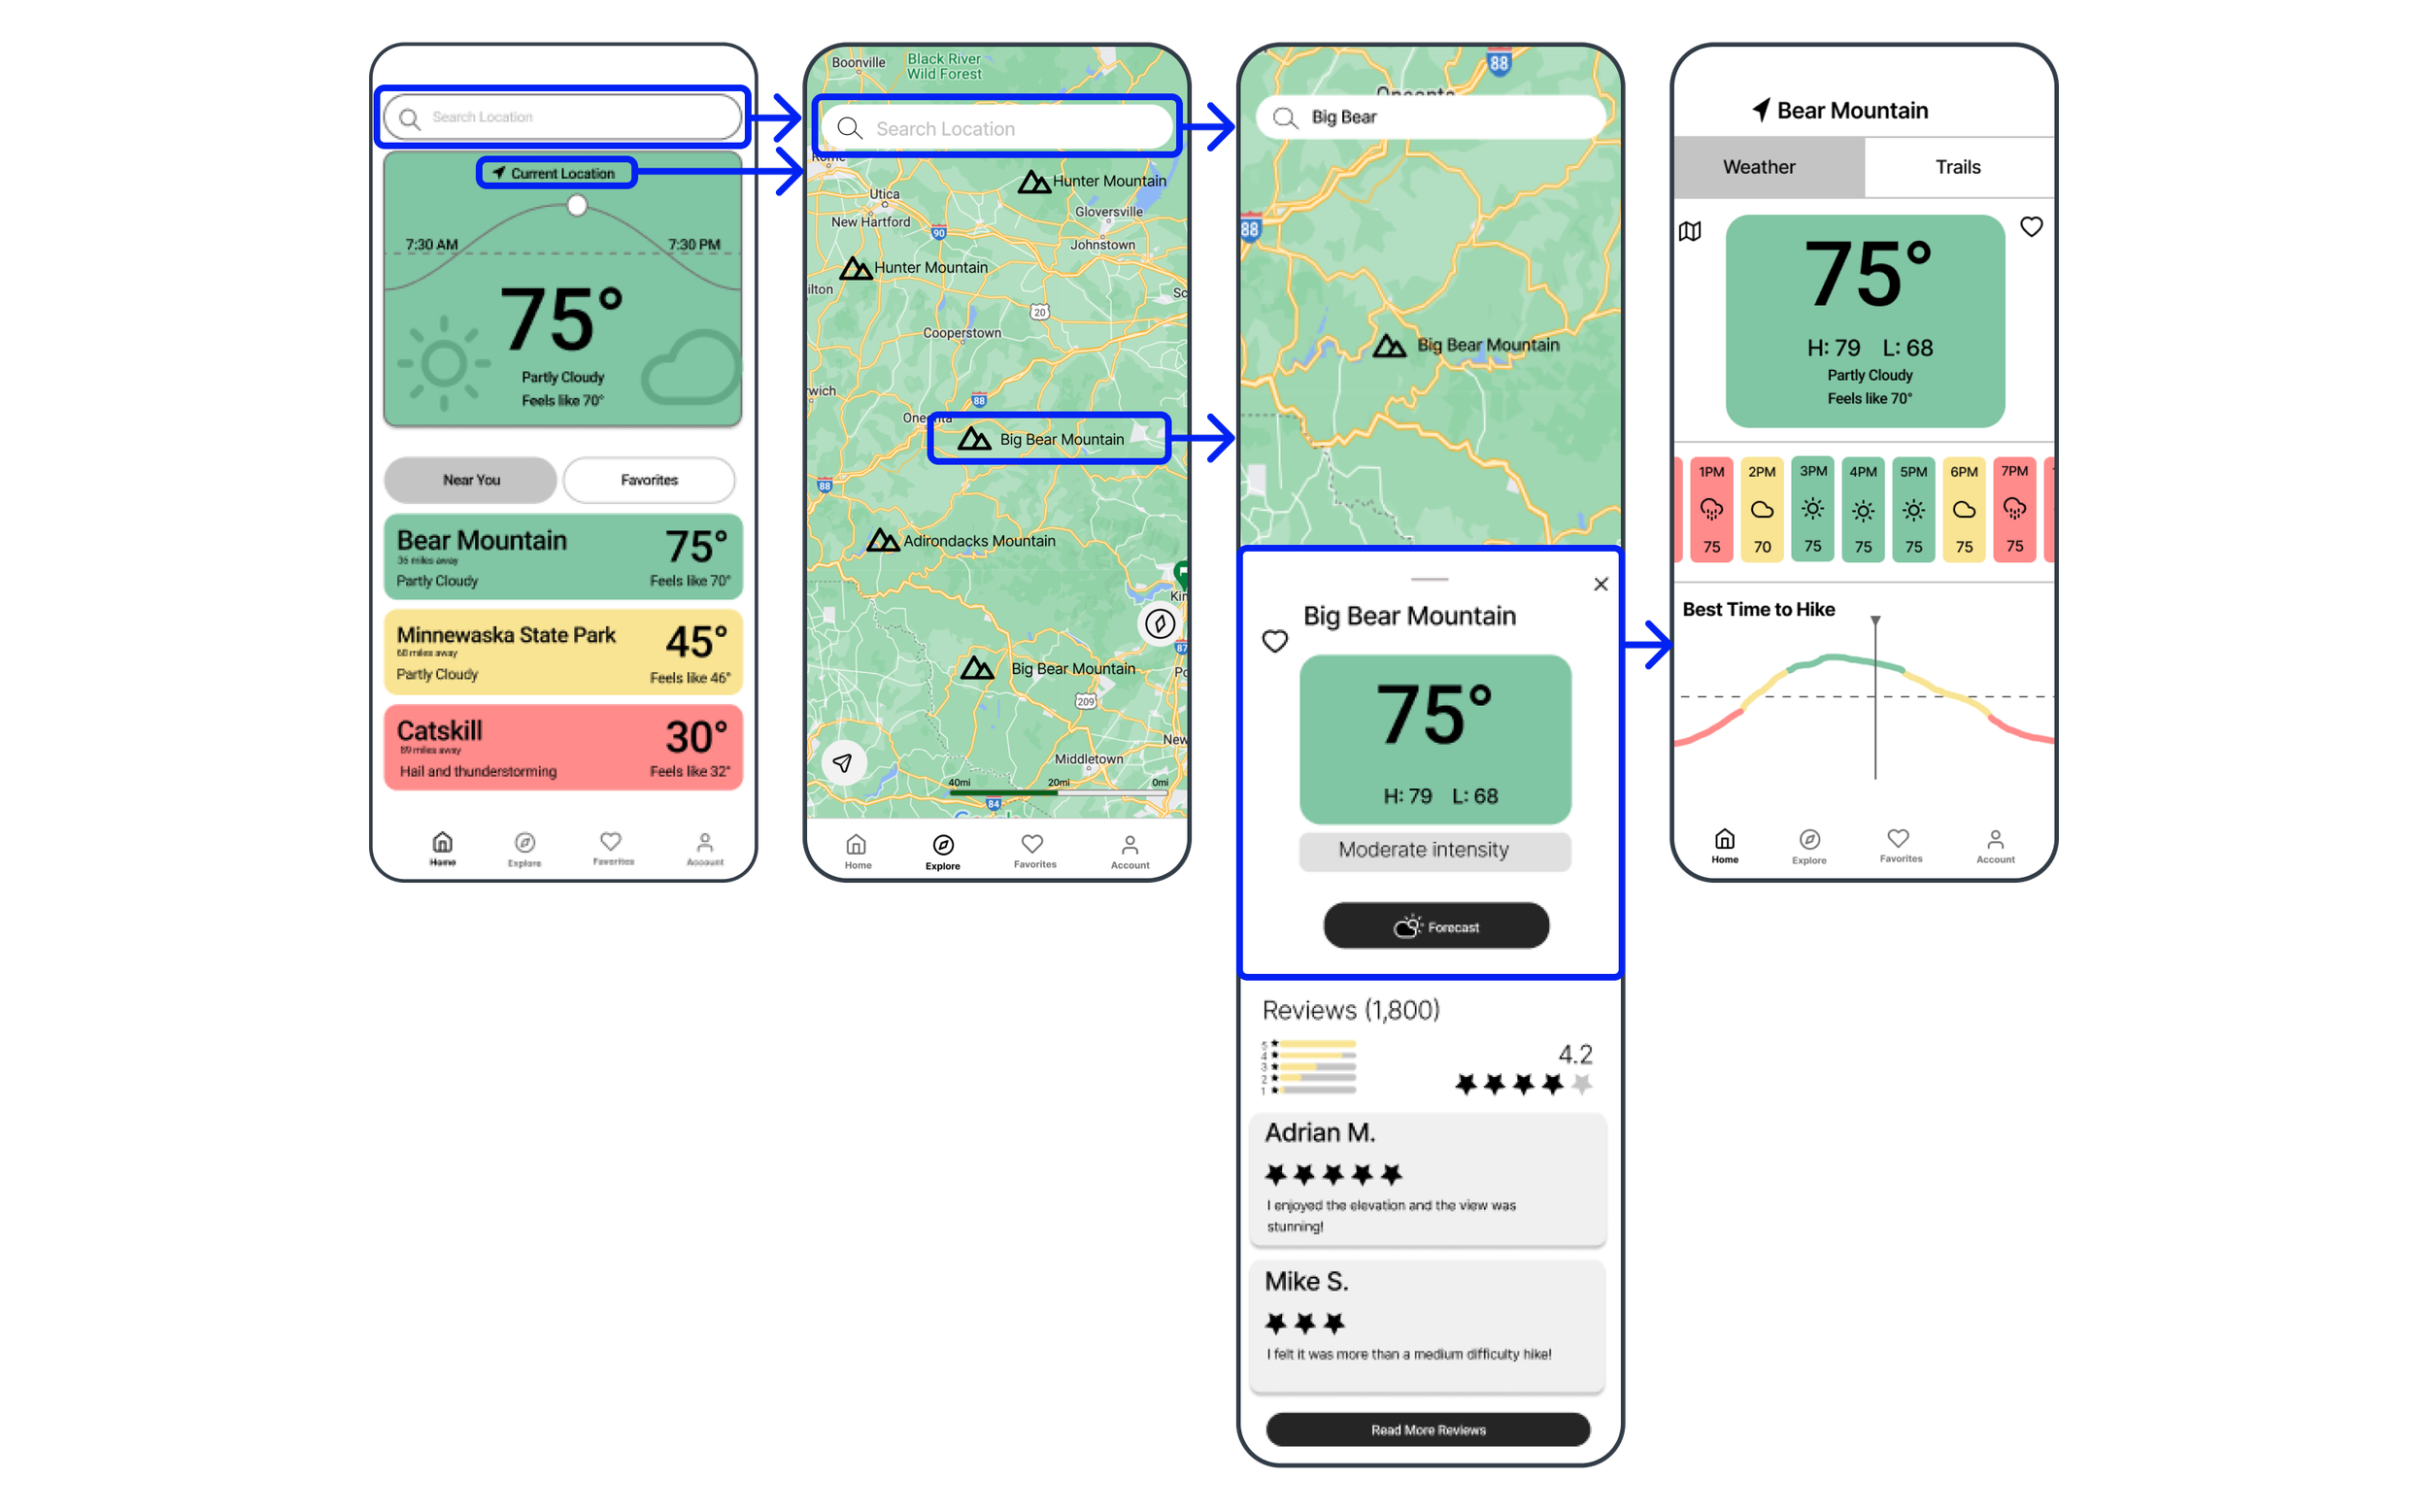
We provided multiple routes to access the Map section to enhance users' ability to discover new hiking locations. Users can click on the search bar at the top of the homepage, their current location, or the explore button at the bottom of the navbar. Users can select mountains or locations they find appealing on the map page. A summary of the site will pop up with reviews and trail intensity. If the user is interested, they can move to more details on the weather.
TRAILS
We developed a map and trails feature from our user research and competitive/comparative analysis. Our interviews found that 50% of users were willing to pay for offline maps. We decided to implement it into the app and the mountain weather forecast; however, this feature was ultimately cut as per our client's decision.
MID-FIDELITY USER TESTING
We conducted 29 tests on our Mid-Fedelity prototype using the online tool Maze. Due to the limitations of Maze, we could not observe users' reactions to our app's experience. Due to these conditions, we had to approach our data with caution. Nonetheless, we found that 78% of users could navigate the app. The white "X"s on the screens below indicate where users tapped while using our app on Maze.
Participants completed four tasks:
Task 1 - Sign up and set your preferences
Task 2 - Search for a mountain on the map
Task 3 - Look for the humidity on Bear Mountain
Task 4 - Find the intensity on trail 1 of Bear Mountain
Task 1 had a 100% success rate. Task 4 had an 85.2% success rate, with 70.4% getting it right on the first try; However, per clients request we did not pursue the trails feature further. I’ll focus on Task 2 and 3 Below:
TASK 2 - SEARCH FOR A MOUNTAIN ON THE MAP
This task had a 77.7% success rate, with only 40.7% getting it right on their first try. The lack of interactivity in the search bar and map prototypes on the homepage and explore page needs to be clarified for participants, highlighting the limitations of online testing. This reinforced our need to nail down how users would navigate through the various pages of our app.
TASK 3 - LOOK FOR THE HUMIDITY ON BEAR MOUNTAIN
This task had a 92.6% success rate, but only 22.2% got it right on their first try. Users needed to be clicking on the right tabs and icons, indicating confusion about where to find in-depth weather details. We added a distinct and prominent button for the in-depth weather details page to address this.
HI-FIDELITY
PROTOTYPE
To begin the high-fidelity design process, we focused on color-coded outputs and used animated illustrations created with Adobe. We aimed for a vibrant, enthusiastic app that reflected its focus on positive mental health.
Some critical changes we made included:
Designing a minimalist interface to emphasize the colorful visuals
Creating unique illustrations for the onboarding page and weather scenarios
Increasing the saturation of green, yellow, and red colors for more prominent algorithmic alerts
Redesigning features with round outlines for a more interactive feel, such as the circular redesign of the homepage's weather
Refocusing the "Trails" page to a "Trails conditions" page that reflects live updates on mountain conditions.
The final prototype, Hiker's Weather, is a beautiful and informative app that makes checking the weather for an upcoming hike effortless, showcasing solutions for client requests, user needs, and visual imagination.
ONBOARDING PROCESS
WEATHER PAGE, DETAIL PAGE, & TRAIL CONDITIONS
EXPLORE PAGE AND FAVORITES PAGE
REFLECTION
NEXT STEPS
MUST DO:
Test the high-fidelity prototype with users and refine it further
Conduct deeper research with intermediate and advanced hikers
Test the effectiveness of the onboarding preference questions with users
Build out the profile/account page
SHOULD DO:
Develop a maps section with trails outlined and their amenities
Conduct user research to make the "Trails conditions" section more refined and robust
COULD DO:
Implement reviews of mountains/trails with comments and pictures
Add a section for the hike's elevation, length, and trail type
Conduct an "end of hike" survey to source data on peak trail hours
CONCLUSION
Our client loved our solutions, and we're proud of the final product we created. Hiker's Weather is set to launch in fall 2023, and we're excited to see it in action.
This project was both challenging and rewarding, especially for me as a city dweller with limited hiking experience. It allowed me to push my boundaries and dive into a world unknown to me. Hiker’s Weather has left me inspired to explore nature further.
Hikers like Erik will benefit from this app as it enables them to be in the know about the weather conditions of the trails and make the best decisions for themselves and their loved ones. With a simple yet beautiful interface, they can effortlessly check color-coded outputs and see if the day’s weather fits their preferences.
